S&P 500, VIX Key Takeaways
- The CBOE’s S&P 500 Volatility Index, or VIX, fell to close last week below 15, implying subdued expectations for near-term stock market volatility.
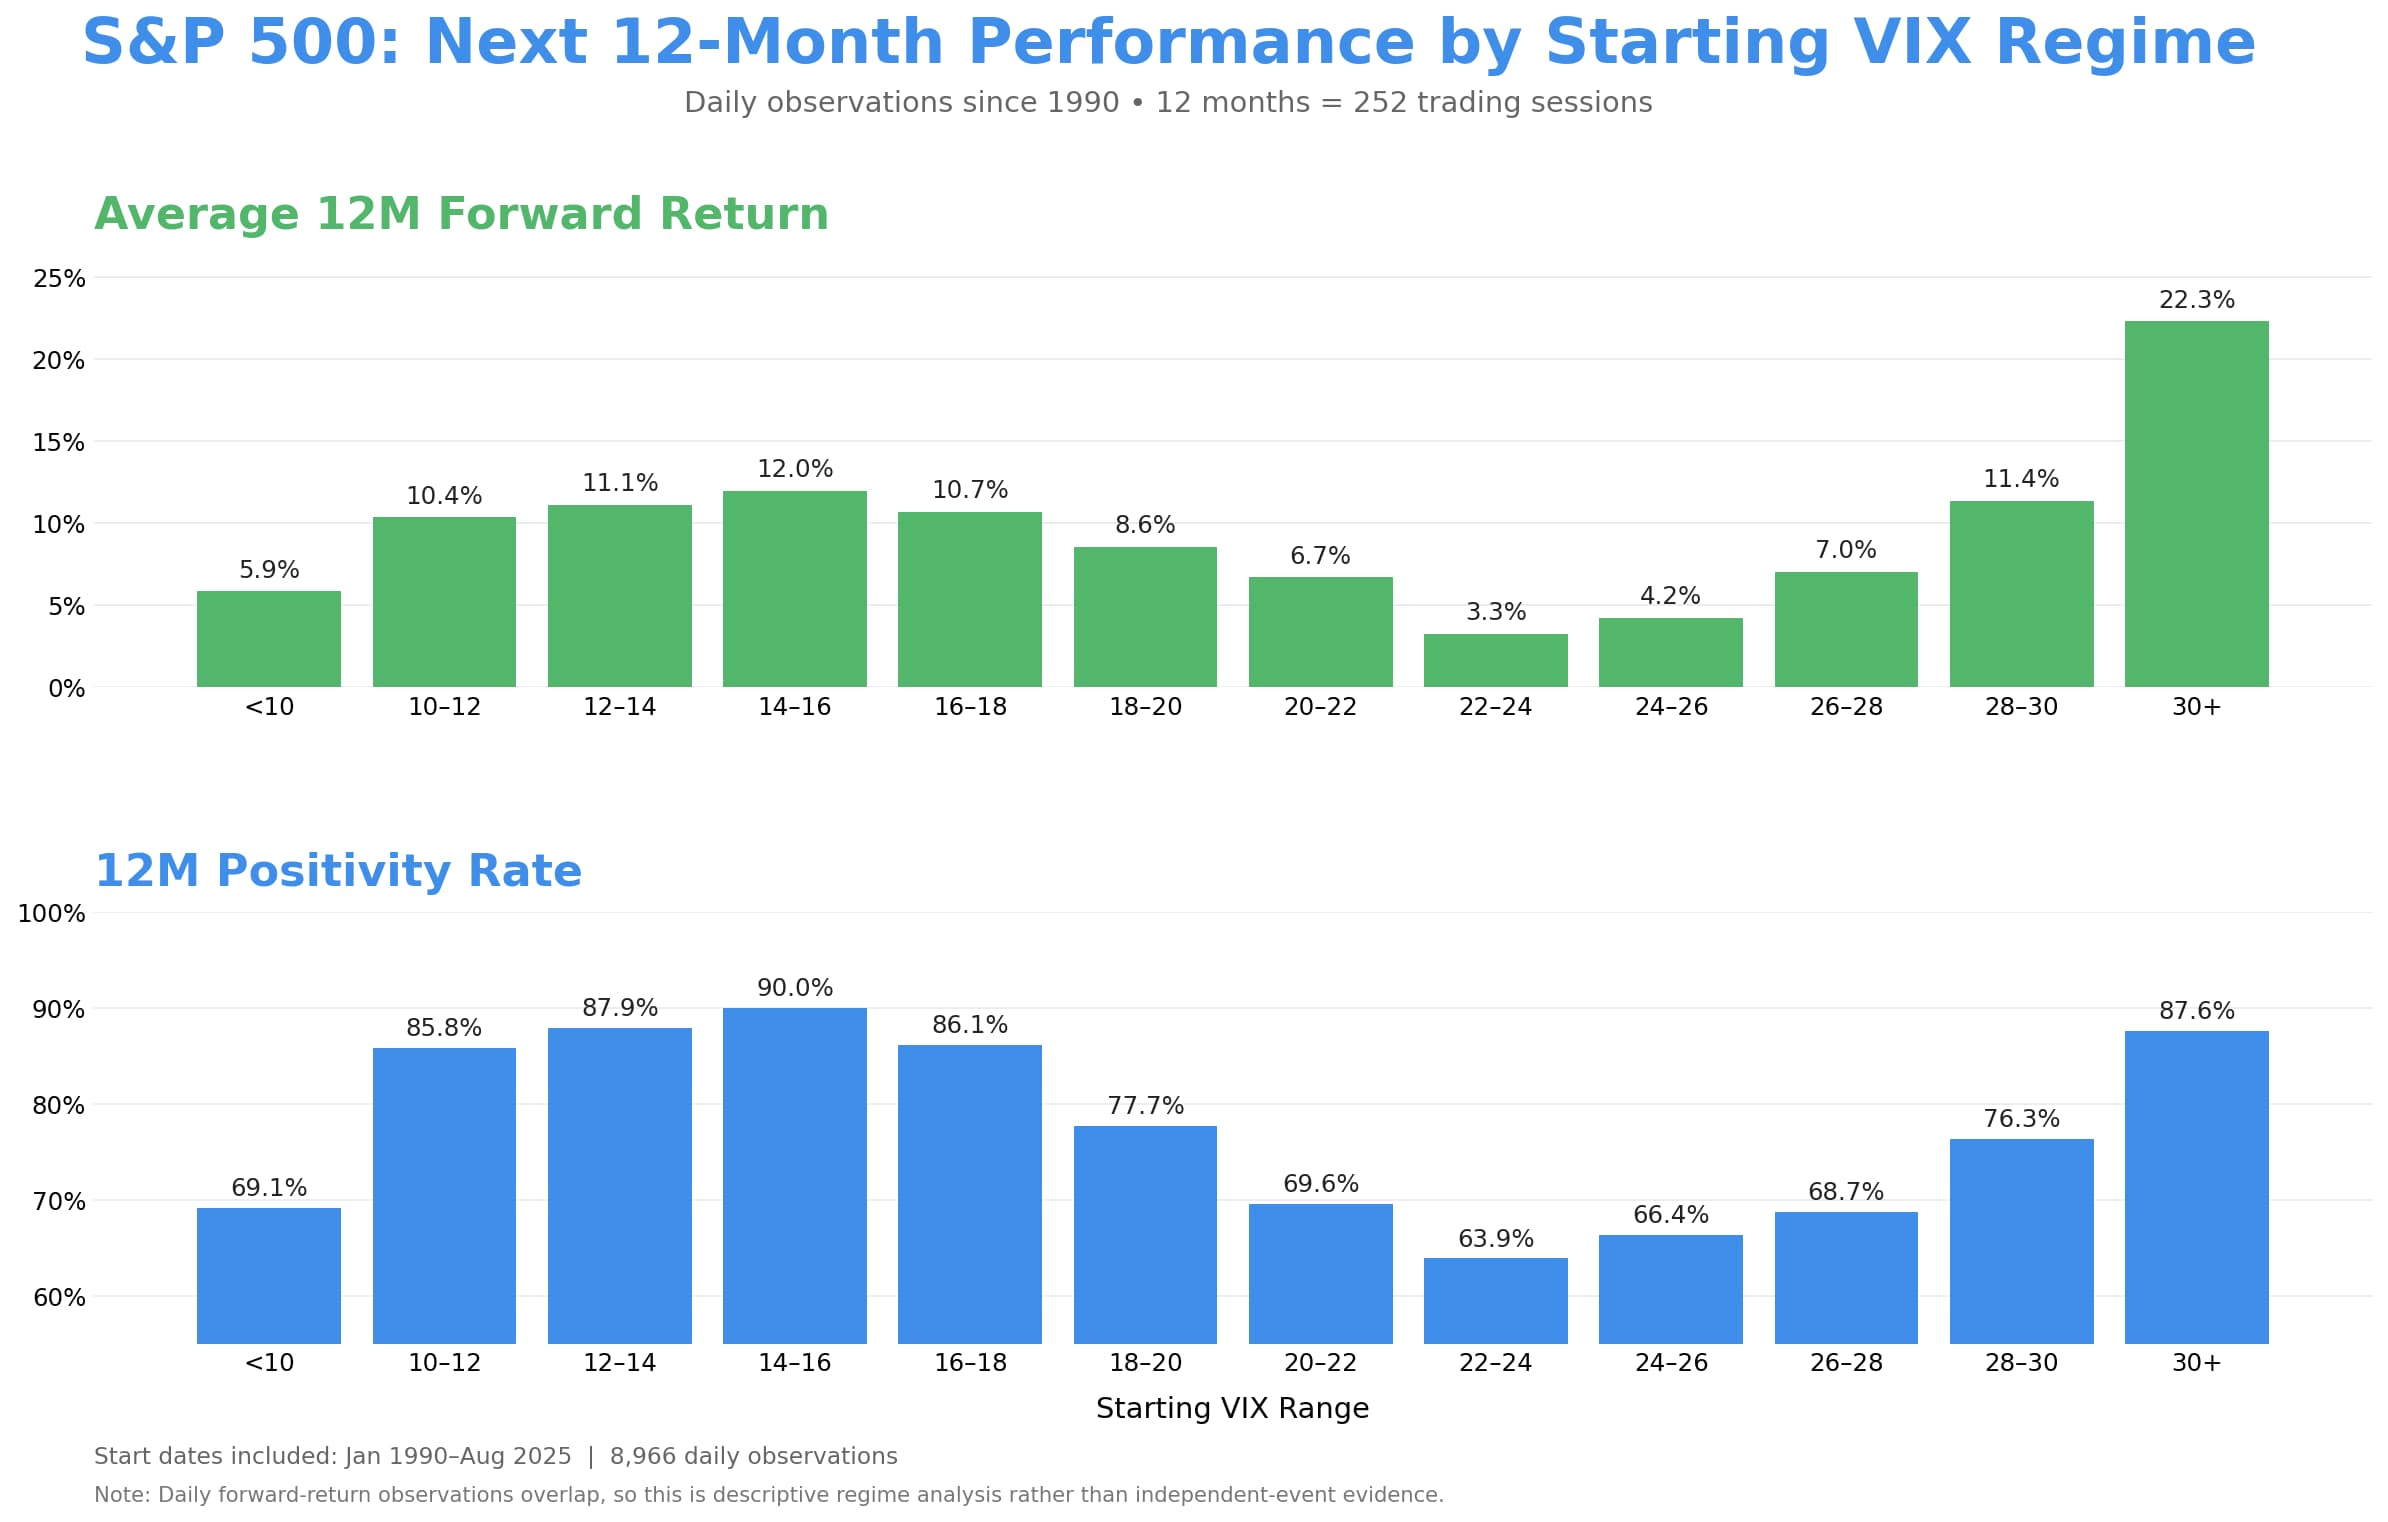
- VIX readings between 12 and 16 have been followed by average 12-month S&P 500 returns of roughly 11–12%, with the index higher one year later in nearly 90% of observations.
- Traders may be looking to enjoy a “Goldilocks Zone” for both the weather and potential future stock market returns ahead of the fall.
The proverbial “Dog Days of Summer” are well and truly at hand.
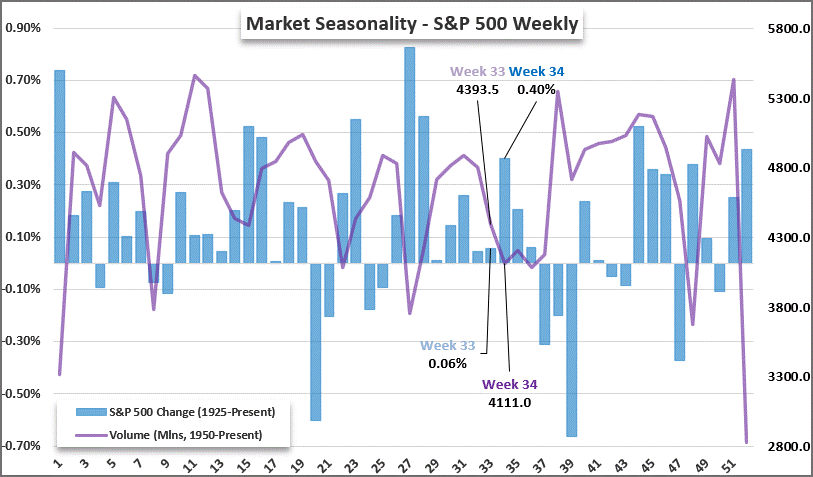
Historically, volume in major indices like the S&P 500 forms a trough in August, with returns similarly muted, as my colleague John Kicklighter has noted:
Source: StoneX, John Kicklighter. Past performance is not indicative of future returns.
With major earnings reports from the “Magnificent Seven” now behind us (Nvidia’s report next week is the last one to watch) and the ongoing conflict in the Middle East now simmering at a low boil, traders are squeezing in their last beach trips ahead of the seasonal ramp up in volatility and trading volume in September.
The relative market calm is captured by the CBOE’s S&P 500 Volatility Index, or VIX, which fell to close last week below 15, implying subdued expectations for near-term stock market volatility. What many readers may not know is that these types of relatively low VIX readings have historically been very favorable for 1-year stock market returns:
Source: StoneX, TradingView. Past performance is not indicative of future returns.
As the chart above shows, VIX readings between 12 and 16 have been followed by average 12-month S&P 500 returns of roughly 11–12%, with the index higher one year later in nearly 90% of observations. In other words, a VIX reading in the 12-16 range is solidly in the “Goldilocks Zone” for S&P 500 returns historically.
The relationship between VIX levels and S&P 500 returns is notably not linear; extremely low volatility is not necessarily better. The VIX <10 bucket returned only 5.9% on average and was positive just 69.1% of the time, perhaps reflecting outright complacency on the part of traders.
Historically, the weakest VIX zone for S&P 500 forward returns has been between roughly 22-26. At 22-24, the average subsequent return falls to only 3.3%, with a 63.9% positivity rate. Once volatility becomes much more extreme, however, the relationship reverses sharply. VIX 30+ produced a 22.3% average subsequent 12-month return and an 87.6% positivity rate, consistent with the tendency for extreme fear/crisis periods to be followed by substantial equity recoveries.
One important statistical caveat to this study: these are daily observations with overlapping 12-month windows, so the 8,966 observations are not independent samples. The chart is best interpreted as descriptive evidence of how forward returns have behaved across volatility regimes, rather than as 8,966 separate market episodes.
So as summer winds down, traders may be looking to enjoy a ‘Goldilocks Zone’ for both the weather and the market backdrop. Historically, a VIX in the low-to-mid teens has been associated with some of the strongest and most consistently positive 12-month S&P 500 returns.
-- Written by Matt Weller, Global Head of Research
Check out Matt’s Daily Market Update videos on YouTube and be sure to follow Matt on Twitter: @MWellerFX
StoneX TV content is created, produced, and distributed solely by StoneX Media Ltd (“StoneX TV”) and is provided for informational and educational purposes only. StoneX TV does not provide investment, financial, legal, or tax advice and does not make any recommendation or endorsement of any investment strategy, transaction, or financial instrument. Nothing in this content constitutes, or should be construed as, investment advice or a recommendation to buy, sell, or hold any financial instrument, including securities, futures, derivatives, digital assets, foreign exchange products, or CFDs. This content does not constitute an offer, invitation, or solicitation to engage in any investment activity. The information presented is general in nature and is not tailored to the financial situation, investment objectives, or risk tolerance of any specific person. You should not rely on this content as a substitute for independent professional advice. Investing and trading in financial instruments involves significant risk of loss and is not suitable for all investors. Past performance is not indicative of future results. Any views or opinions expressed are those of the presenter at the time of publication and are subject to change without notice. Such views may not necessarily reflect those of StoneX Media Ltd or its affiliates. StoneX Media Ltd and its affiliates, including StoneX Group Inc., may from time to time have positions in, or engage in transactions involving, the financial instruments referenced. This content may include general market commentary and opinion. It does not constitute independent investment research and has not been prepared in accordance with legal requirements designed to promote the independence of investment research. StoneX Media Ltd is not authorised or regulated to provide investment services and does not act in a fiduciary capacity. StoneX Media Ltd is incorporated in Ireland and operates in accordance with applicable Irish law. It is a wholly owned subsidiary of StoneX Group Inc. and is a separate legal entity from other subsidiaries within the StoneX Group, which may be regulated in various jurisdictions. StoneX Media Ltd does not act on behalf of, or provide services for, any regulated affiliate. This content is not directed at, and may not be distributed to, any person in any jurisdiction where such distribution would be contrary to local laws or regulations. Supporting documentation for any claims, comparisons, statistics, or technical data may be made available upon reasonable request, where applicable.